Performance comparisons between herds
PATBQ is currently the only tool allowing Quebec beef cattle breeders to compare themselves, both on the genetic aspects and the breeding monitoring data.
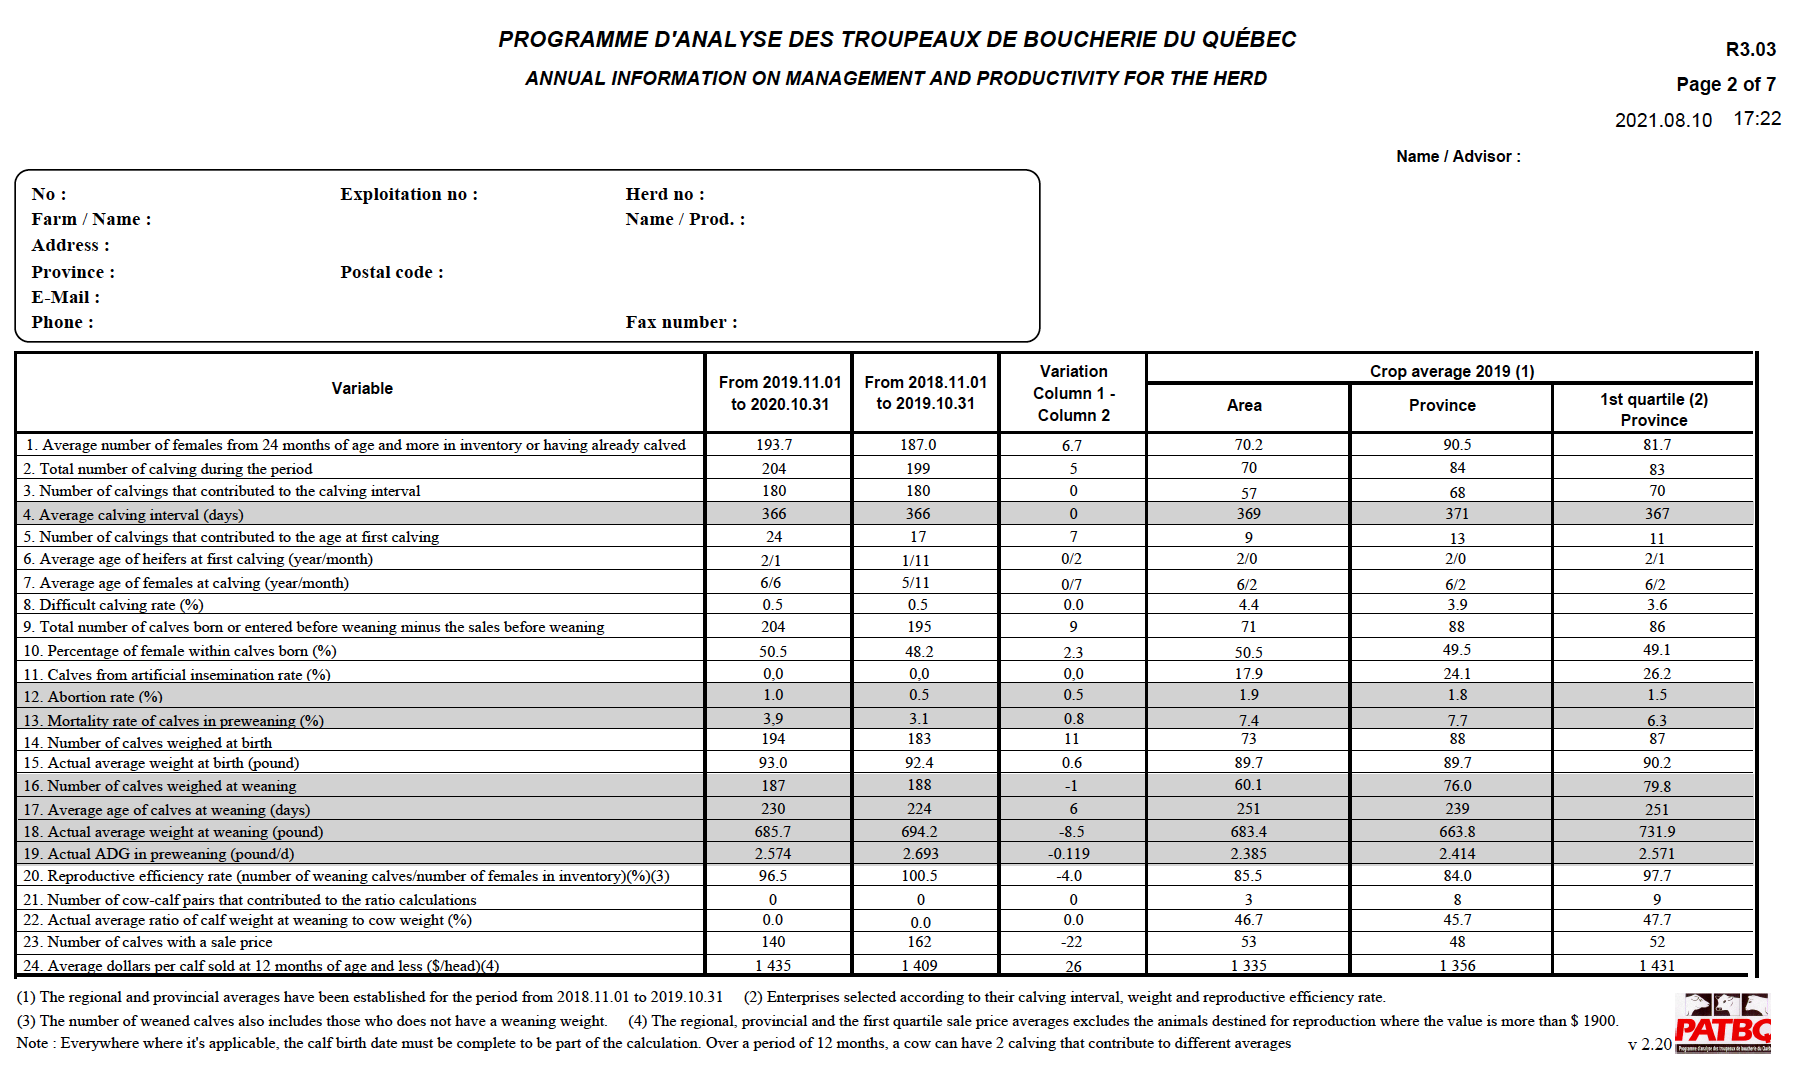
From the PATBQ software, it's easy to extract various analysis reports of the breeder's genetic and technical-economic data and compare them with data from other breeders enjoying the same PATBQ advantage. It is therefore easy to determine where you stand in relation to other breeders based on the percentile ranks.
Average production cycles from 2015 to 2019
The table below shows the average, per production cycle, of different performance data for the herds registered with the PATBQ between 2015 and 2019.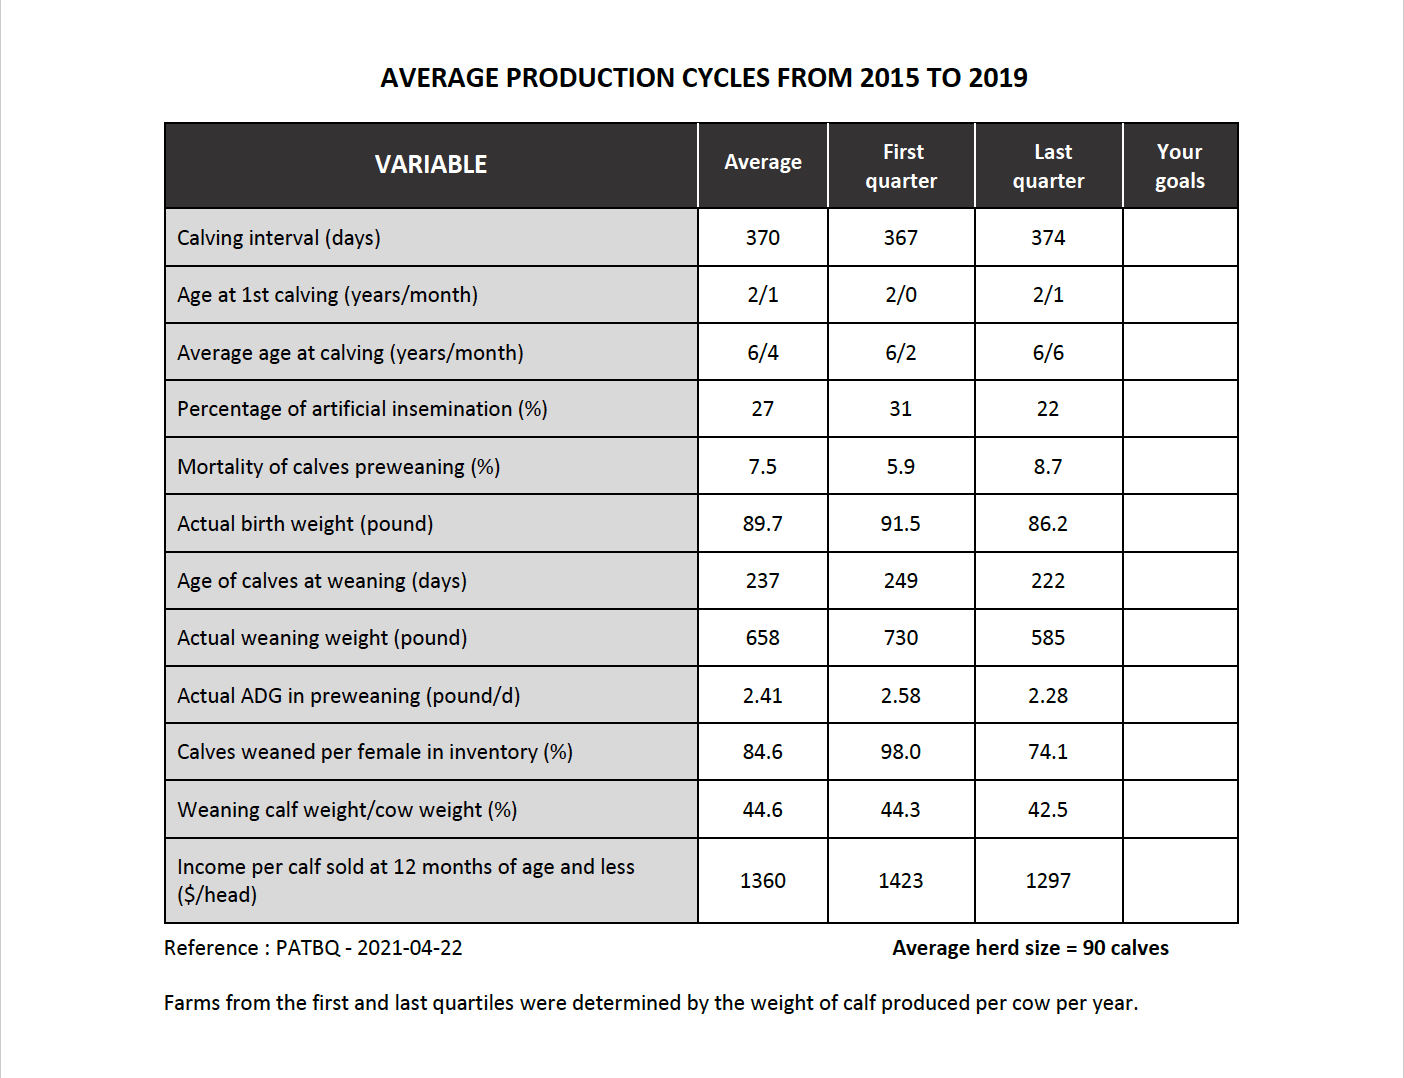
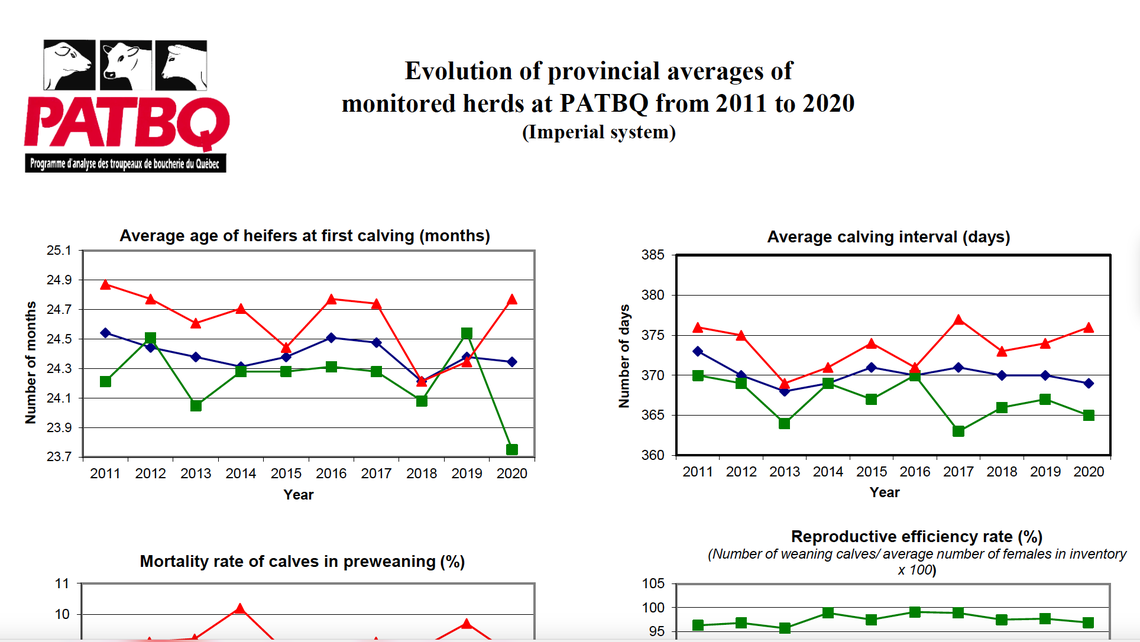
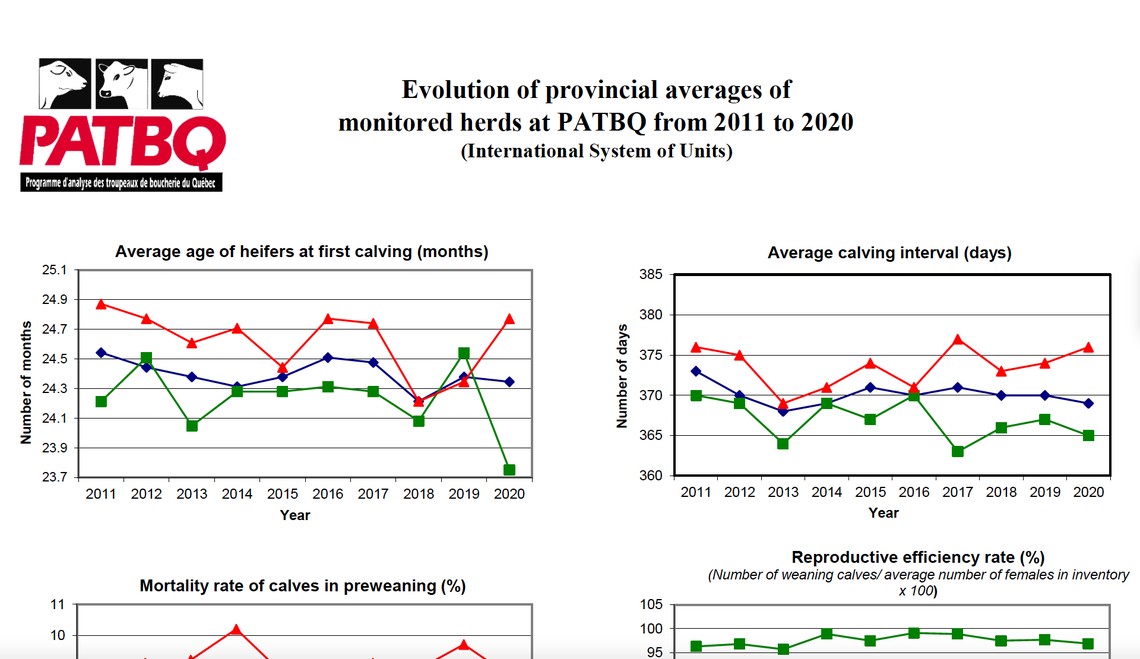
Evolution of provincial averages of monitored herds at PATBQ from 2011 to 2020
With data for first and last quarter enterprises.
Extracting reports
From the PATBQ software, it is easy to extract various breeder's analysis reports and technico-economic data and compare them with data from other breeders with the same PATBQ advantage. It is therefore easy to determine where we stand in relation to other breeders based on the various averages.
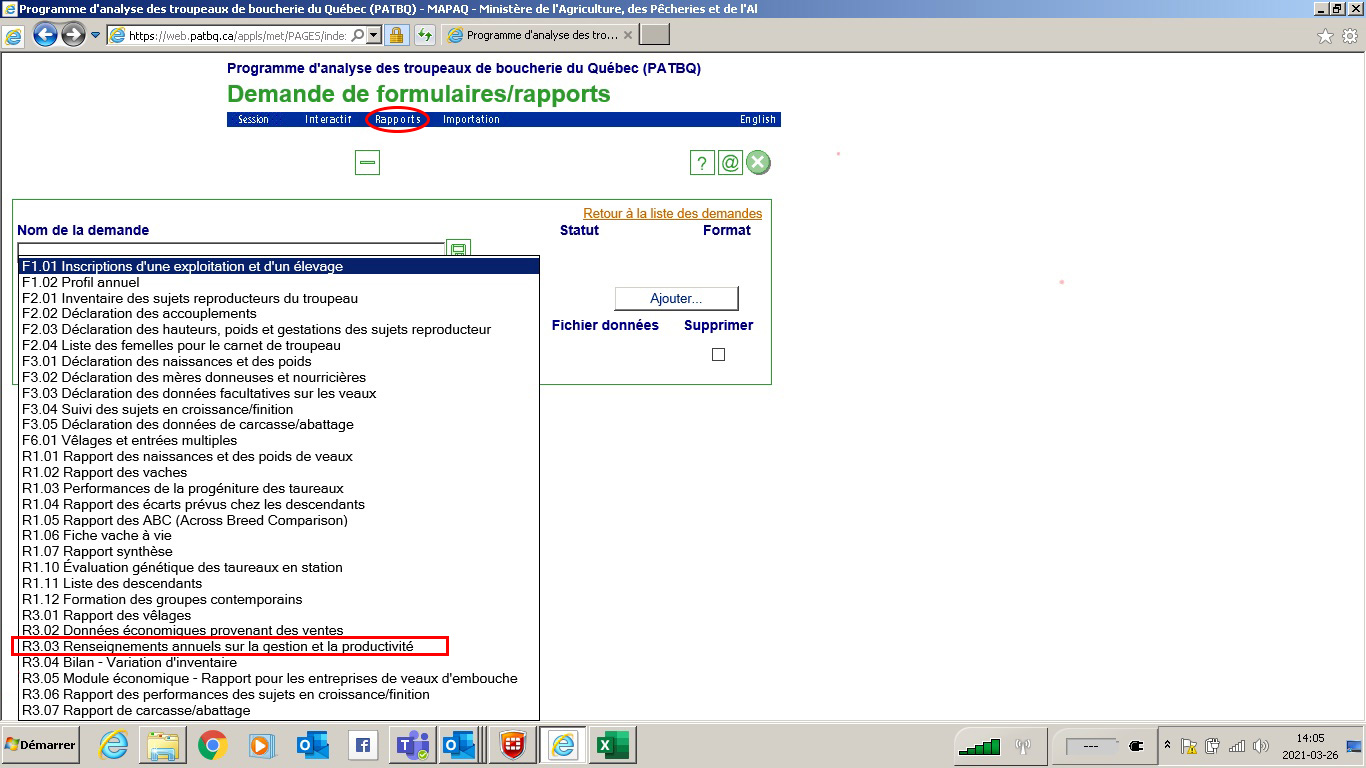
Using the "Reports" tab located in the blue attachment bar of the PATBQ software, it is possible to extract the R3-03 report which allows to compare the results of a breeder with the averages of his region, province and first provincial quarter.
